Evidence Reassessment, Private Portfolios & Admin Roles
Reassess Evidence with Max
Evaluating your progress is now easier — with Max. When you add fresh materials to a project (for instance a new deck, an updated report, a transcript) select them on the Files tab and ask Max to reassess. Max evaluates the new content against your maturity model, compares it with what's already on the board, and proposes a bundle of changes: new evidence notes, status moves, and status updates for the objectives the material touches.
You Stay in Control
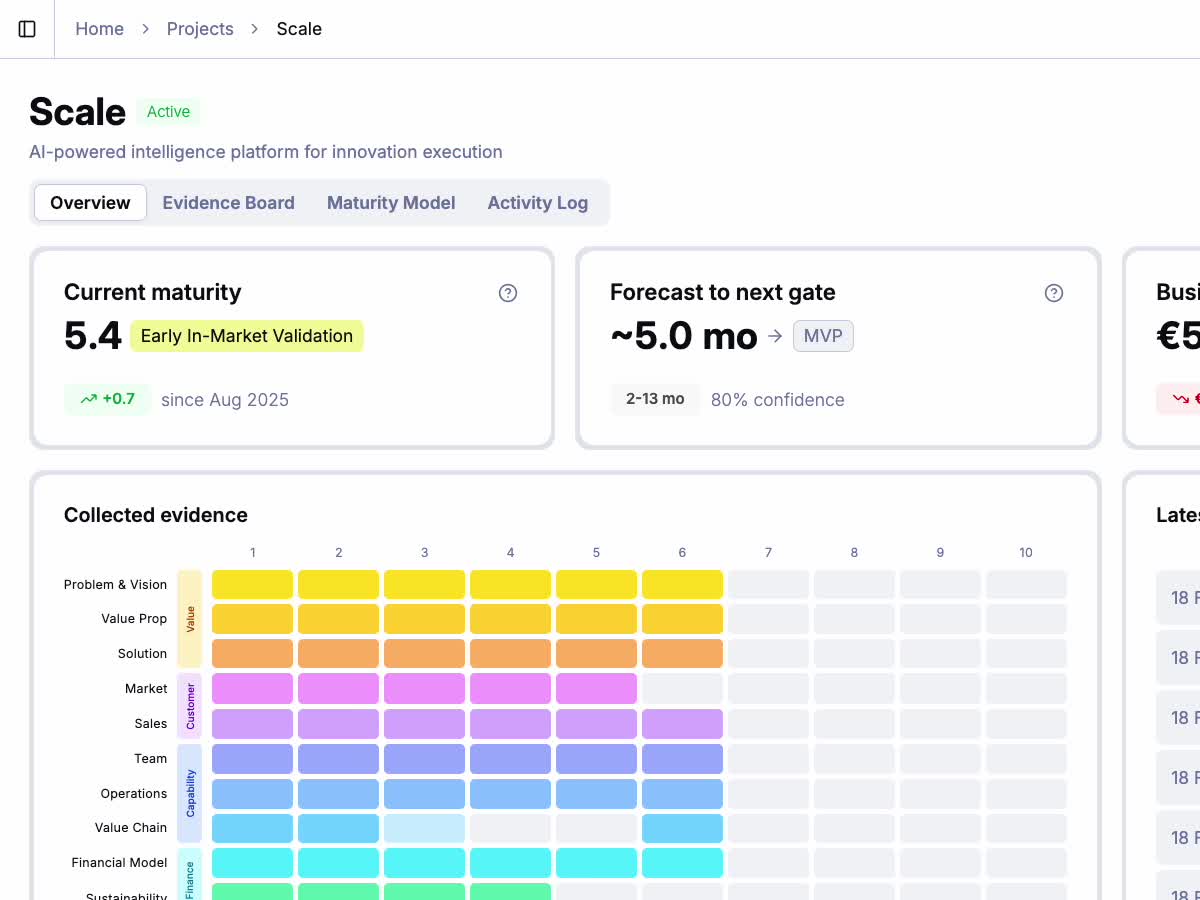
Max proposes; you decide. Reassessment is fully human-in-the-loop — Max never changes the board on its own. It bundles its findings into a set of proposed changes, and you go through each one to accept it, edit it, or reject it. Only what you approve is applied, so your team's decisions and hand-written notes are never overwritten. Each reassessment also shows its estimated effect on your project's average maturity and time-to-next-gate forecast, so you can weigh a change before you take it.
Keep Confidential Portfolios Private
Keep sensitive work visible only to the people who should see it. Until now, everyone in an organization could see every project. You can now mark a portfolio as private — its projects, evidence, files, and other details are visible only to the members you grant access to. Everyone else sees that the portfolio exists but none of its contents, and a lock badge in the sidebar makes private portfolios easy to spot.
Administrator and Member Roles
Decide who manages access, not just who has it. Everyone in an organization now has one of two roles — Administrator or Member — shown on the People page. Administrators manage users, assign roles, and control which portfolios are private and who can reach them; members continue to work exactly as before. When an admin needs to step into a private portfolio, they can grant themselves access, and the change is recorded for a clear audit trail.